Tutorial: running a simulation in interactive mode
This tutorial will guide you through the basic usage of MetaSpread through the interactive mode, from running a simulation to visualizing the results.
Installation
If you haven’t installed MetaSpread yet, use the following command:
pip install metaspread
or:
python -m pip install metaspread
Running metaspread
Once installed, create a directory for this tutorial called “tutorial-interactive”:
mkdir tutorial-interactive
Then, navigate to the directory:
cd tutorial-interactive
Use the following command on a terminal to run MetaSpread in interactive mode:
python -m metaspread
Since this is the first time you run MetaSpread, it will create a file called simulation_configs.csv. This file contains the default parameters for the simulation, which you can modify later.
Afterwards, the interactive interface will be launched, displaying the main menu.:
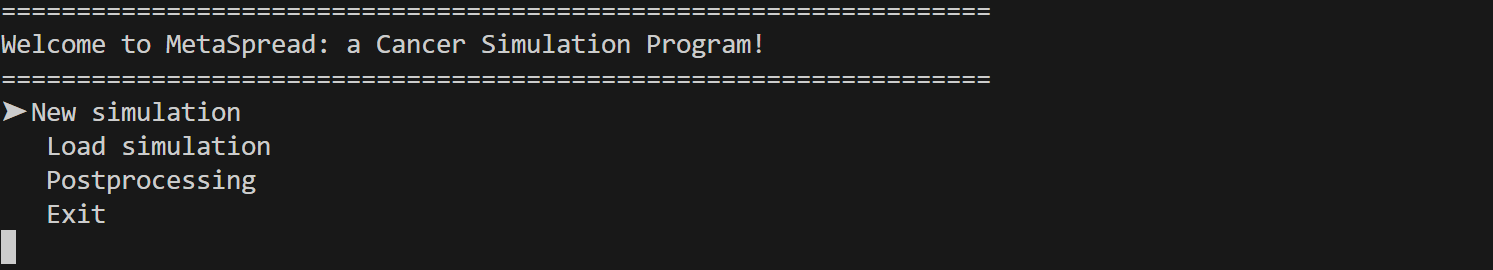
The main menu provides several options for running simulations and visualizing results. To select an option, move with the up and down arrow keys. To select an option, press enter.
First, we will focus on running a new simulation.
Running a Simulation
Editing the parameters: the default parameters are already set in the
simulation_configs.csvfile. You can edit this file to change the parameters of your simulation. To edit the file, you can use any text editor or spreadsheet software that supports CSV format. For this tutorial, we will change the number of grids to 2. For simplicity, we will use a text editor. The file should look like this: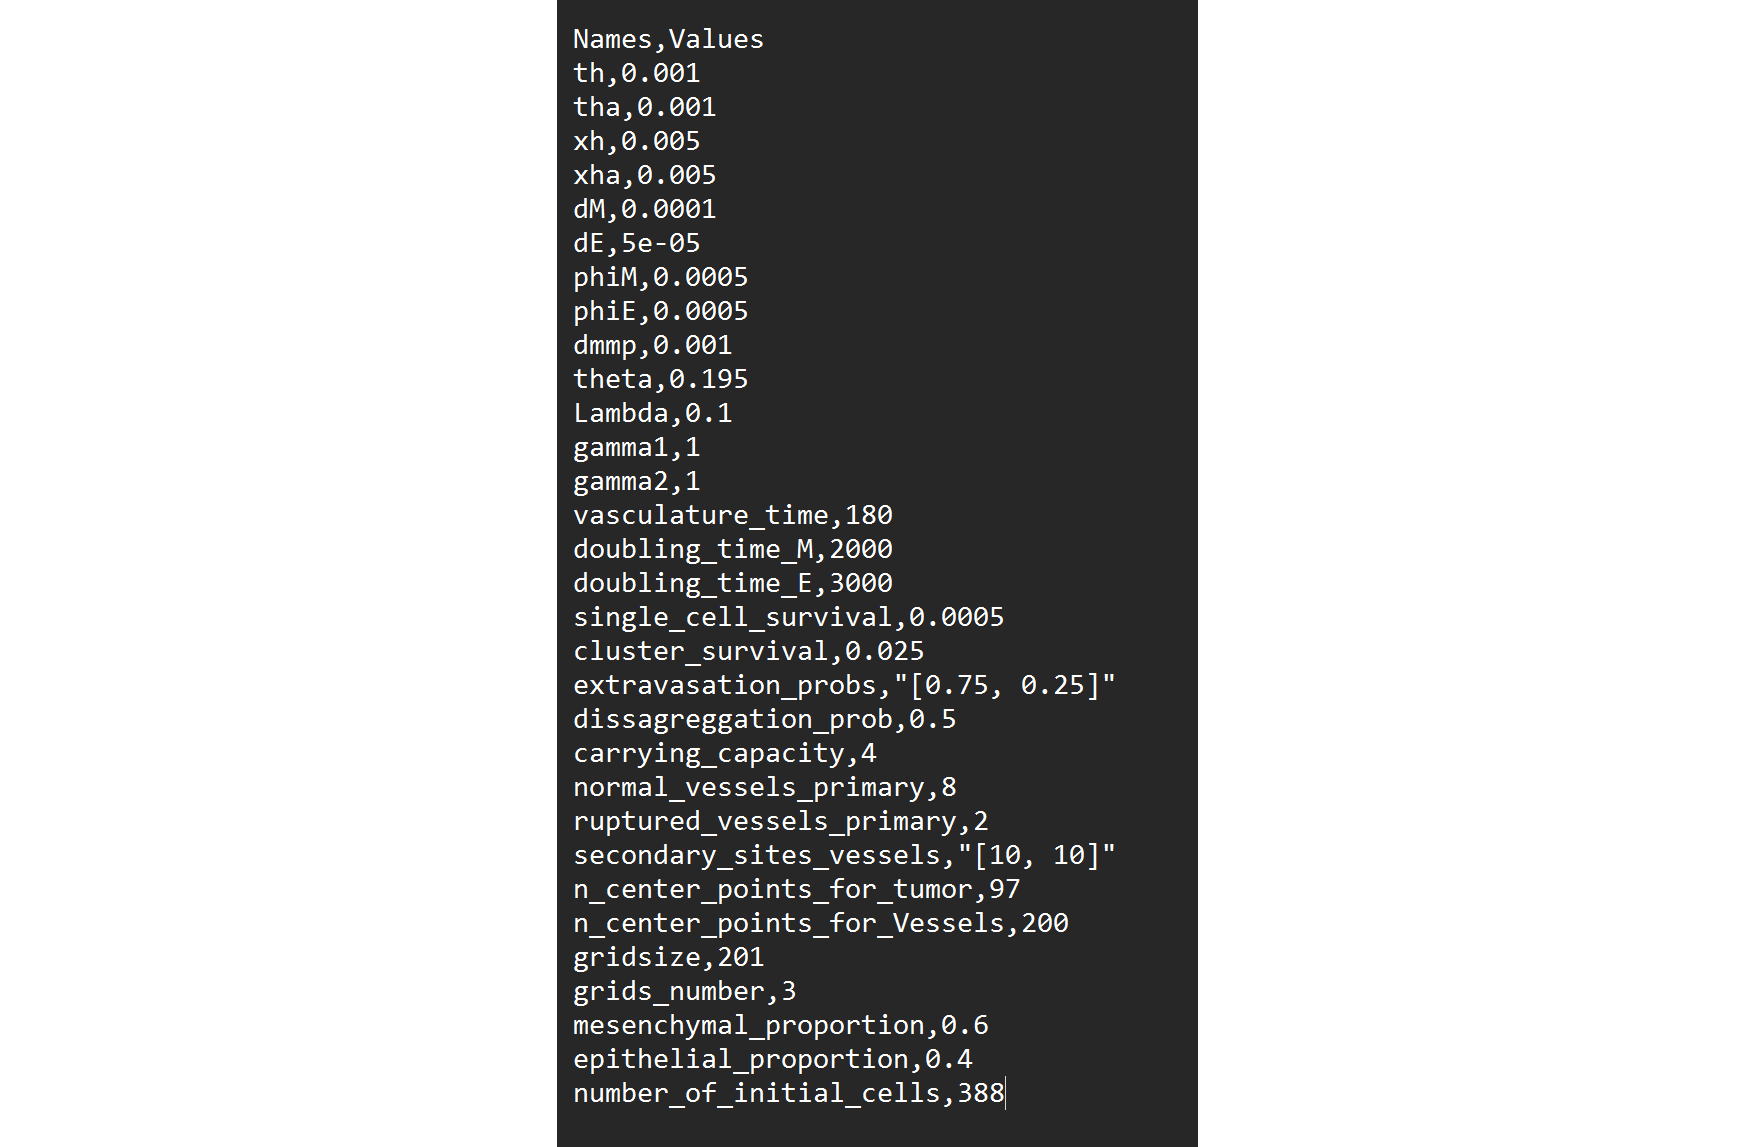
In order to change the amount the number of grids, we are going to change the value at the
grids_numberrow: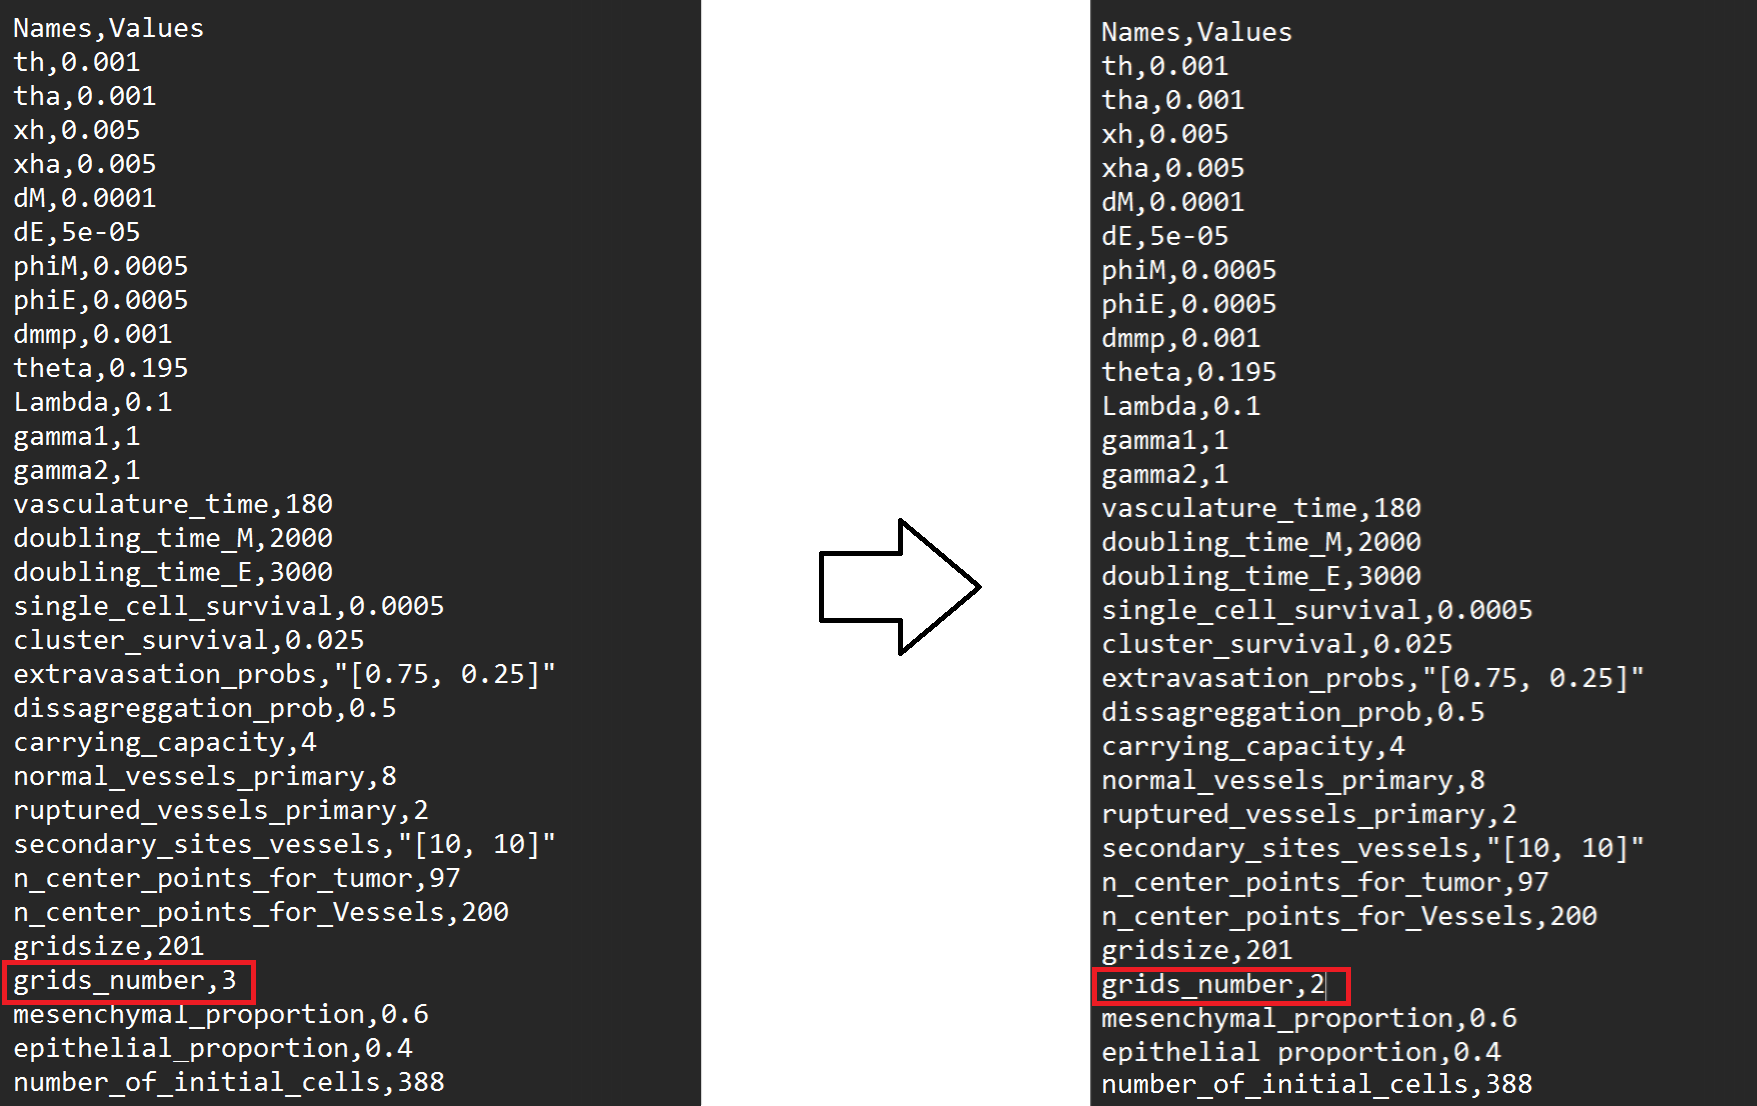
However, this will give an error when running the simulation:

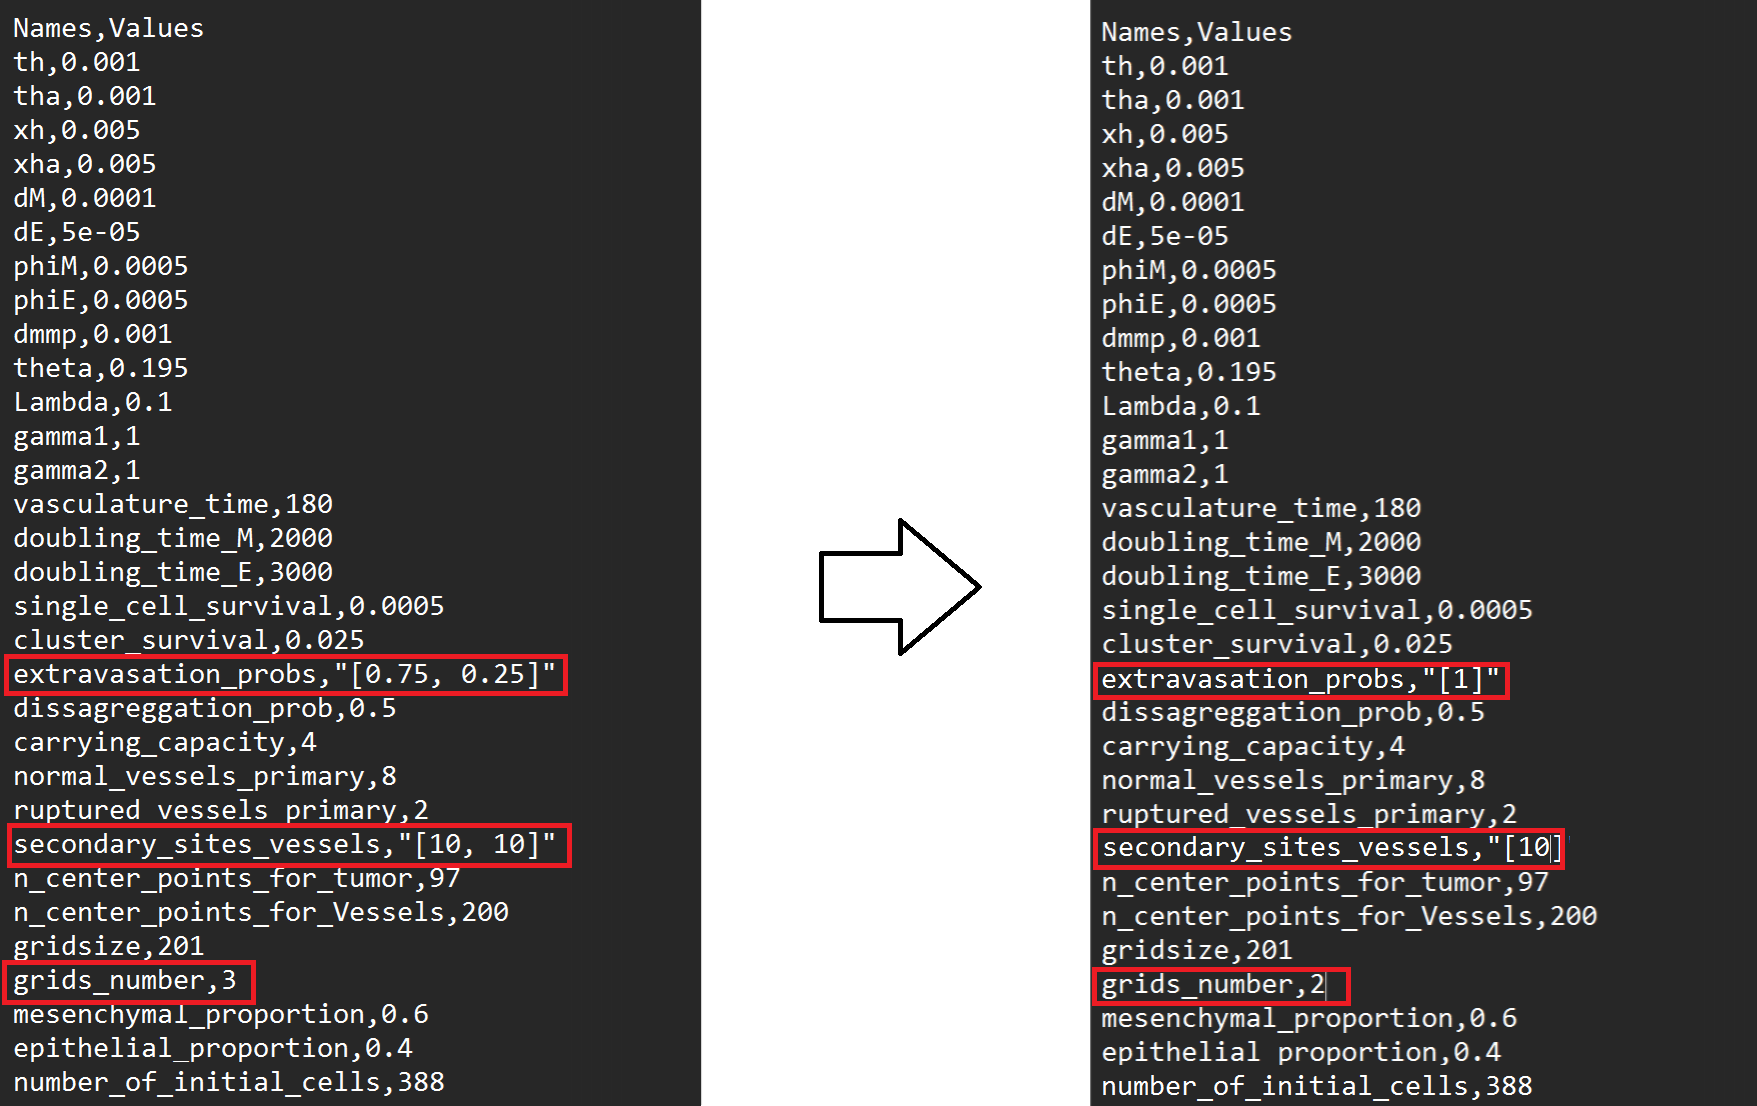
This is because there are certain parameters that depend on the number of grids, such as the
extravasation_probsandsecondary_sites_vessels. Thus, it is necessary to change these parameters as well. Theextravasation_probsparameter should be a list of probabilities for each secondary grid that sum up to 1, and thesecondary_sites_vesselsparameter should be a list of the number of vessels in each secondary grid.Thus, both of these parameters should have a length equal to the number of grids - 1. Therefore, we can change the parameters accordingly:
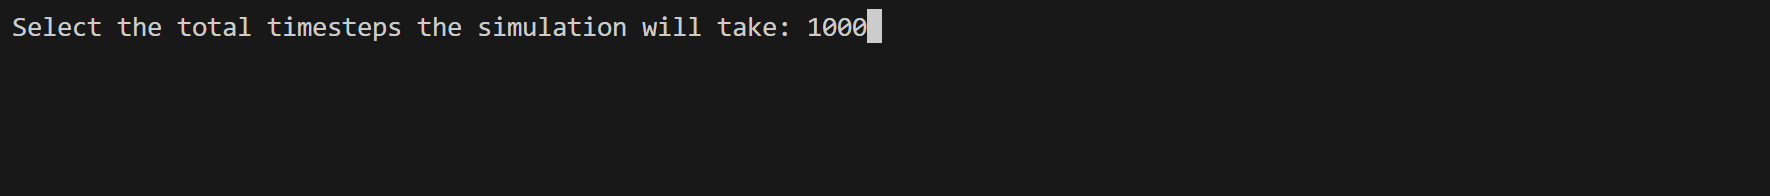
Start a simulation: select the
New Simulationoption from the main menu.Introduce the total time steps for the simulation: you will be prompted to enter the total number of time steps that the simulation will last. For this tutorial, we will use 1000 time steps.
Introduce the interval for saving the results: you will be prompted to enter the interval for saving the results. This is the number of time steps between each saved result. For this tutorial, we will use an interval of 50 time steps.
Simulation completed: once the simulation is completed, you will see a message indicating that the simulation has finished. You should see a folder named
Sim-max_steps-1000-collection_period-50-cells-400-grids_number-2inside the simulators directory. Every simulation will have a name associated with these four parameters: total time steps, data collection period, number of cells, and number of grids.Inside the details of the simulation including mmp2 and ecm concentrations, cell locations, and vasculature data will be saved in CSV files, in their respective folders. These files can be opened with any spreadsheet software or analyzed using Python or R, or with MetaSpread’s built-in data analysis tools.
Postprocessing
After running the simulation, you can use the built-in data analysis and visualization tools. To access them, select the Postprocess Data option from the main menu.
This will open a new menu where you can select the simulation you want to analyze:
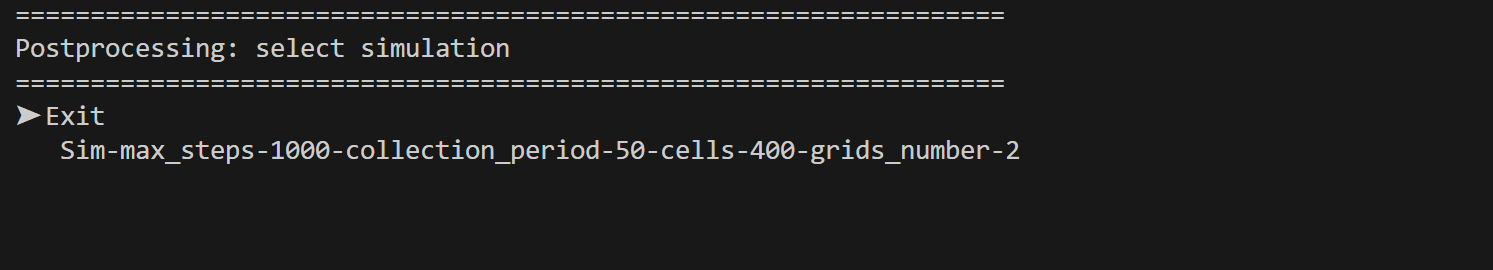
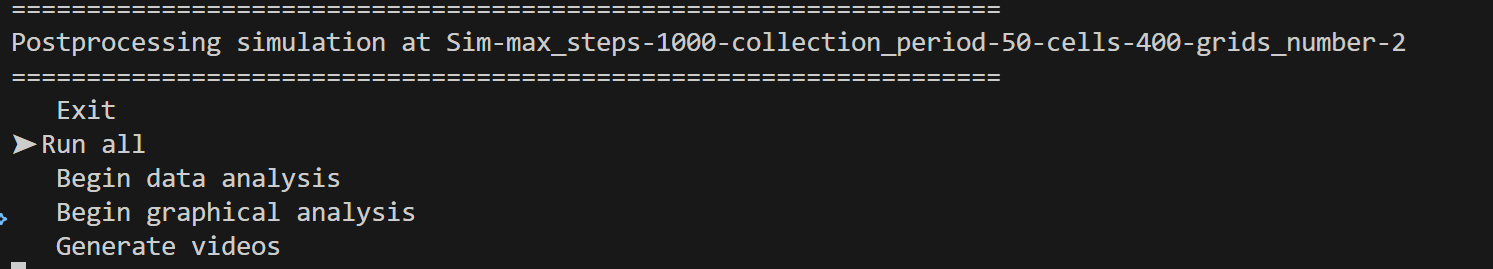
Select the simulation you just ran, and then select the type of postprocessing you want to perform. For this tutorial, we will select the Run all, which will produce both the data analysis and the visualization.
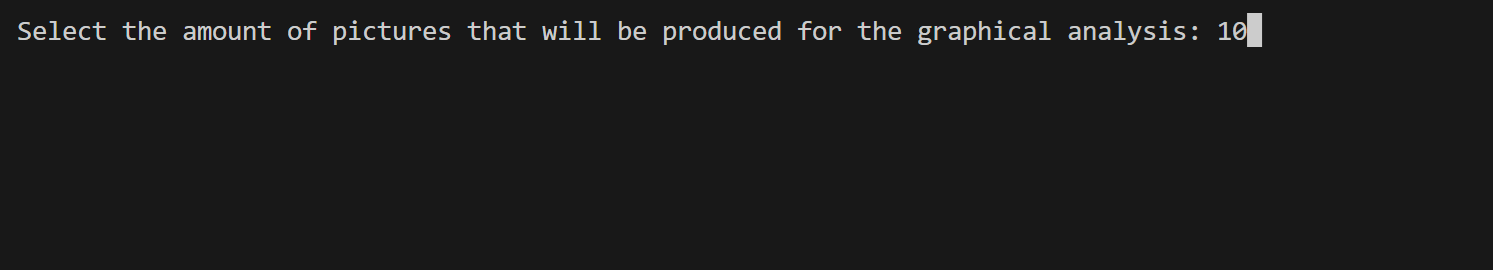
You will be prompted to enter the number of pictures you will generate per plot. Each picture will show the evolution of the simulation over time, and they will server as frames in the final video. For this tutorial, we will use 10 pictures per plot:
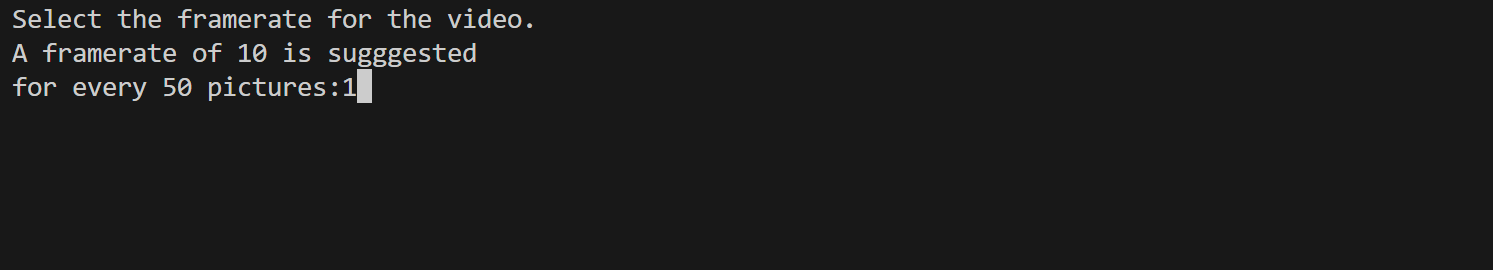
Then, you will be prompted to enter the number of frames per second for the final video. Since we chose to create 10 picture before, a good number would be 1 frame per second, so we get a 10 second video:
Then, the postprocessing will start. The first step will be the data analysis, which will generate a series of CSV files describing the dynamics of the simulation, such as the number of cells in each grid, the concentration of MMP2 and ECM, and the number of vessels in each grid. These files will be saved in the Data Analysis directory inside the simulation folder.
The second step will be the graphical analysis, which will generate a series of plots showing the dynamics of the simulation. These plots will be saved in the Graphical Analysis directory inside the simulation folder.
Finally, the last step will be the video generation, which will create a video showing the evolution of the simulation over time. This video will be saved in the Videos directory inside the simulation folder.
To watch the final result, go to the videos directory and open Tumor dynamics - Grid1.mp4. You should see something like this:
Perfect! You have successfully run a simulation in MetaSpread and visualized the results.
Further comments
Although we ran and visualized a simulation successfully, if you open other videos, for example the ones that count the cells numbers in grids 1 and 2, you will see that nothing changes. That is because the parameters for cell reproduction are greater than our total time steps (2000 for mesenchymal and 3000 for epithelial), so the cells do not reproduce during the simulation. You can experiment by extending the total amount of time steps, or changing them for lower values in the simulation_configs.csv file to see how the simulation changes.